The automobile industry is known for its ever-changing landscape, driven by consumer preferences, economic conditions, and technological advancements. To gain insights into this dynamic industry, we’ve analyzed automobile sales data from Q1 to Q3 for the years 2021, 2022, and 2023. In this blog post, we’ll delve into the numbers and draw conclusions about the performance of various automobile brands during this period.
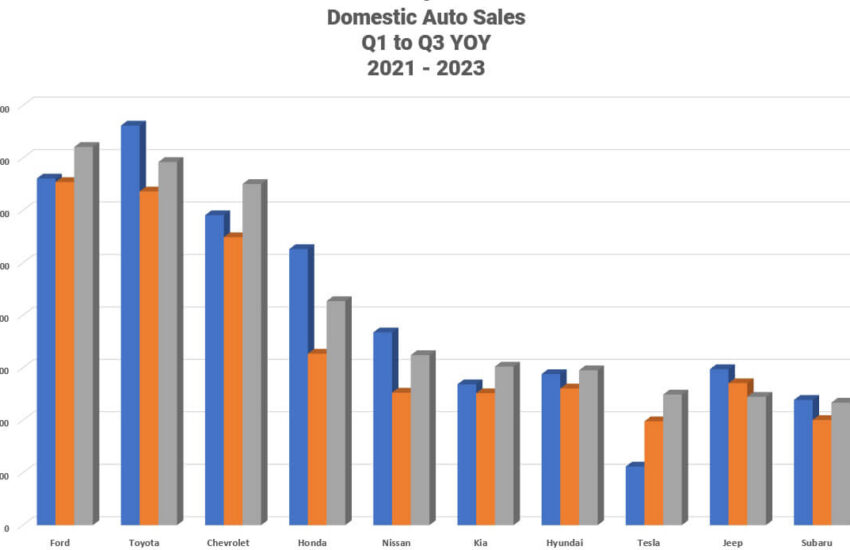
Domestic Automobile Sales Data | Q1 to Q3 YTD | 2021 – 2023
| Brand | 2021 | 2022 | 2023 |
| Ford | 1,321,622 | 1,308,326 | 1,441,957 |
| Toyota | 1,523,425 | 1,272,205 | 1,384,441 |
| Chevrolet | 1,181,753 | 1,097,850 | 1,300,708 |
| Honda | 1,052,485 | 653,605 | 854,200 |
| Nissan | 735,055 | 505,307 | 648,215 |
| Kia | 537,108 | 503,084 | 604,691 |
| Hyundai | 575,946 | 520,944 | 590,458 |
| Tesla | 223,302 | 396,069 | 498,000 |
| Jeep | 594,668 | 541,293 | 489,438 |
| Subaru | 477,472 | 401,115 | 467,220 |
| GMC | 399,783 | 374,007 | 429,396 |
| Ram | 495,412 | 415,321 | 405,114 |
| Mazda | 268,749 | 215,392 | 274,307 |
| Mercedes-Benz | 253,655 | 254,393 | 254,803 |
| BMW | 243,661 | 230,644 | 253,773 |
| Volkswagen | 281,124 | 228,359 | 232,539 |
| Lexus | 261,258 | 198,612 | 224,309 |
| Audi | 161,662 | 123,817 | 167,452 |
| Dodge | 175,362 | 145,070 | 156,938 |
| Buick | 150,973 | 76,547 | 124,690 |
| Chrysler | 74,139 | 87,661 | 123,357 |
| Cadillac | 95,614 | 95,569 | 110,836 |
| Acura | 126,939 | 74,652 | 110,535 |
| Volvo | 95,375 | 72,155 | 92,125 |
| Mitsubishi | 77,177 | 65,050 | 67,734 |
| Lincoln | 66,962 | 62,920 | 59,067 |
| Porsche | 51,613 | 49,120 | 56,323 |
| Genesis | 34,329 | 40,799 | 50,341 |
| Infiniti | 47,605 | 33,044 | 49,448 |
| Land Rover | 57,177 | 39,403 | 45,428 |
| Mini | 22,068 | 19,181 | 22,769 |
| Alfa Romeo | 14,196 | 9,811 | 7,590 |
| Jaguar | 12,052 | 7,125 | 6,043 |
| Total | 11,689,721 | 10,118,450 | 11,604,245 |
Overall Market Trends
Before diving into individual brand performance, let’s take a look at the overall market trends. In 2021, the total automobile sales stood at 11,689,721 units, but this number saw a significant decline of 13.4% in 2022, dropping to 10,118,450 units. However, there was a remarkable recovery in 2023, with sales reaching 11,604,245 units, only 0.7% lower than in 2021. This indicates a promising rebound for the industry after the challenging year of 2022.
Now, let’s dissect the performance of individual automobile brands over this period and draw some key conclusions.
Winners and Losers
Ford: Ford’s sales remained relatively stable, with a slight increase of 9.1% from 2021 to 2023. However, the brand faced a 1.0% decline from 2021 to 2022. Despite this, Ford‘s ability to bounce back in 2023 showcases its resilience in the market.
Toyota: Toyota experienced a significant 16.5% drop in sales from 2021 to 2022, but it managed to recover partially with an 8.8% increase in 2023. This suggests that while Toyota faced challenges in 2022, it is on the path to recovery.
Chevrolet: Chevrolet saw an impressive 18.5% surge in sales from 2021 to 2022, and this momentum continued with a 10.1% increase in 2023. This brand appears to have effectively adapted to market demands and is thriving.
Honda: Honda faced a sharp decline of 37.9% in 2022, but it managed to recover by 30.7% in 2023. Nevertheless, it has not yet reached its 2021 sales levels, indicating some ongoing challenges.
Tesla: Tesla’s growth has been remarkable, with a staggering 77.4% increase in sales from 2021 to 2022 and an additional 25.7% growth in 2023. This suggests that the electric vehicle (EV) market is booming, and Tesla is leading the charge.
Buick and Chrysler: Buick’s sales skyrocketed by 62.9% from 2021 to 2022, while Chrysler experienced a 40.7% increase. These brands appear to have adapted well to changing consumer preferences or market conditions.
Acura and Alfa Romeo: Acura’s sales surged by 48.1% in 2022, but Alfa Romeo faced a steep decline of 30.9%. This stark contrast highlights the importance of brand-specific factors in determining sales performance.
Jaguar and Land Rover: Both Jaguar and Land Rover struggled with double-digit declines, indicating challenges within the luxury automobile segment.
Overall Market Resilience: Despite fluctuations in individual brand performance, the overall market showed resilience by rebounding in 2023, with sales almost reaching 2021 levels. This suggests that the industry has the potential to recover from adverse conditions.
Impact of Electric Vehicles (EVs)
One of the standout trends in the data is the impressive growth of Tesla. With EVs gaining popularity due to environmental concerns and technological advancements, Tesla’s success is a clear indicator of the increasing demand for electric vehicles. Other automakers, too, have ventured into the EV market, which is expected to continue growing.
Consumer Preferences and Brand Loyalty
The data also underscores the importance of consumer preferences and brand loyalty. Brands like Ford, Toyota, and Chevrolet, which have a strong presence and loyal customer base, managed to weather the storm of 2022 and recover in 2023. On the other hand, brands like Jaguar and Alfa Romeo, which faced significant declines, may need to reevaluate their strategies to regain consumer trust and market share.
Wrapping It Up
The data from 2021 to 2023 provides valuable insights into the performance of various automobile brands and the overall industry trends. While some brands faced challenges and fluctuations, the industry as a whole exhibited resilience, bouncing back from a difficult year in 2022.
The growth of electric vehicles, exemplified by Tesla’s impressive performance, is a notable trend to watch. Additionally, the data underscores the importance of brand-specific factors, consumer preferences, and adaptability in determining sales success.
As the automobile industry continues to evolve, it will be crucial for brands to stay attuned to market dynamics and consumer demands to remain competitive and thrive in this ever-changing landscape.
AutoByPayment.com offers accurate estimates of new and used car loan payments based on self-selected credit score, current rebates, down payment, and trade equity or negative equity, without customers having to provide their personal identifying information such as email and phone.